Download
click here to download iFrogLab RF Spectrum Analyzer software
How To Use This Application
This document is meant to give a brief introduction on how to use the application.
Introduction
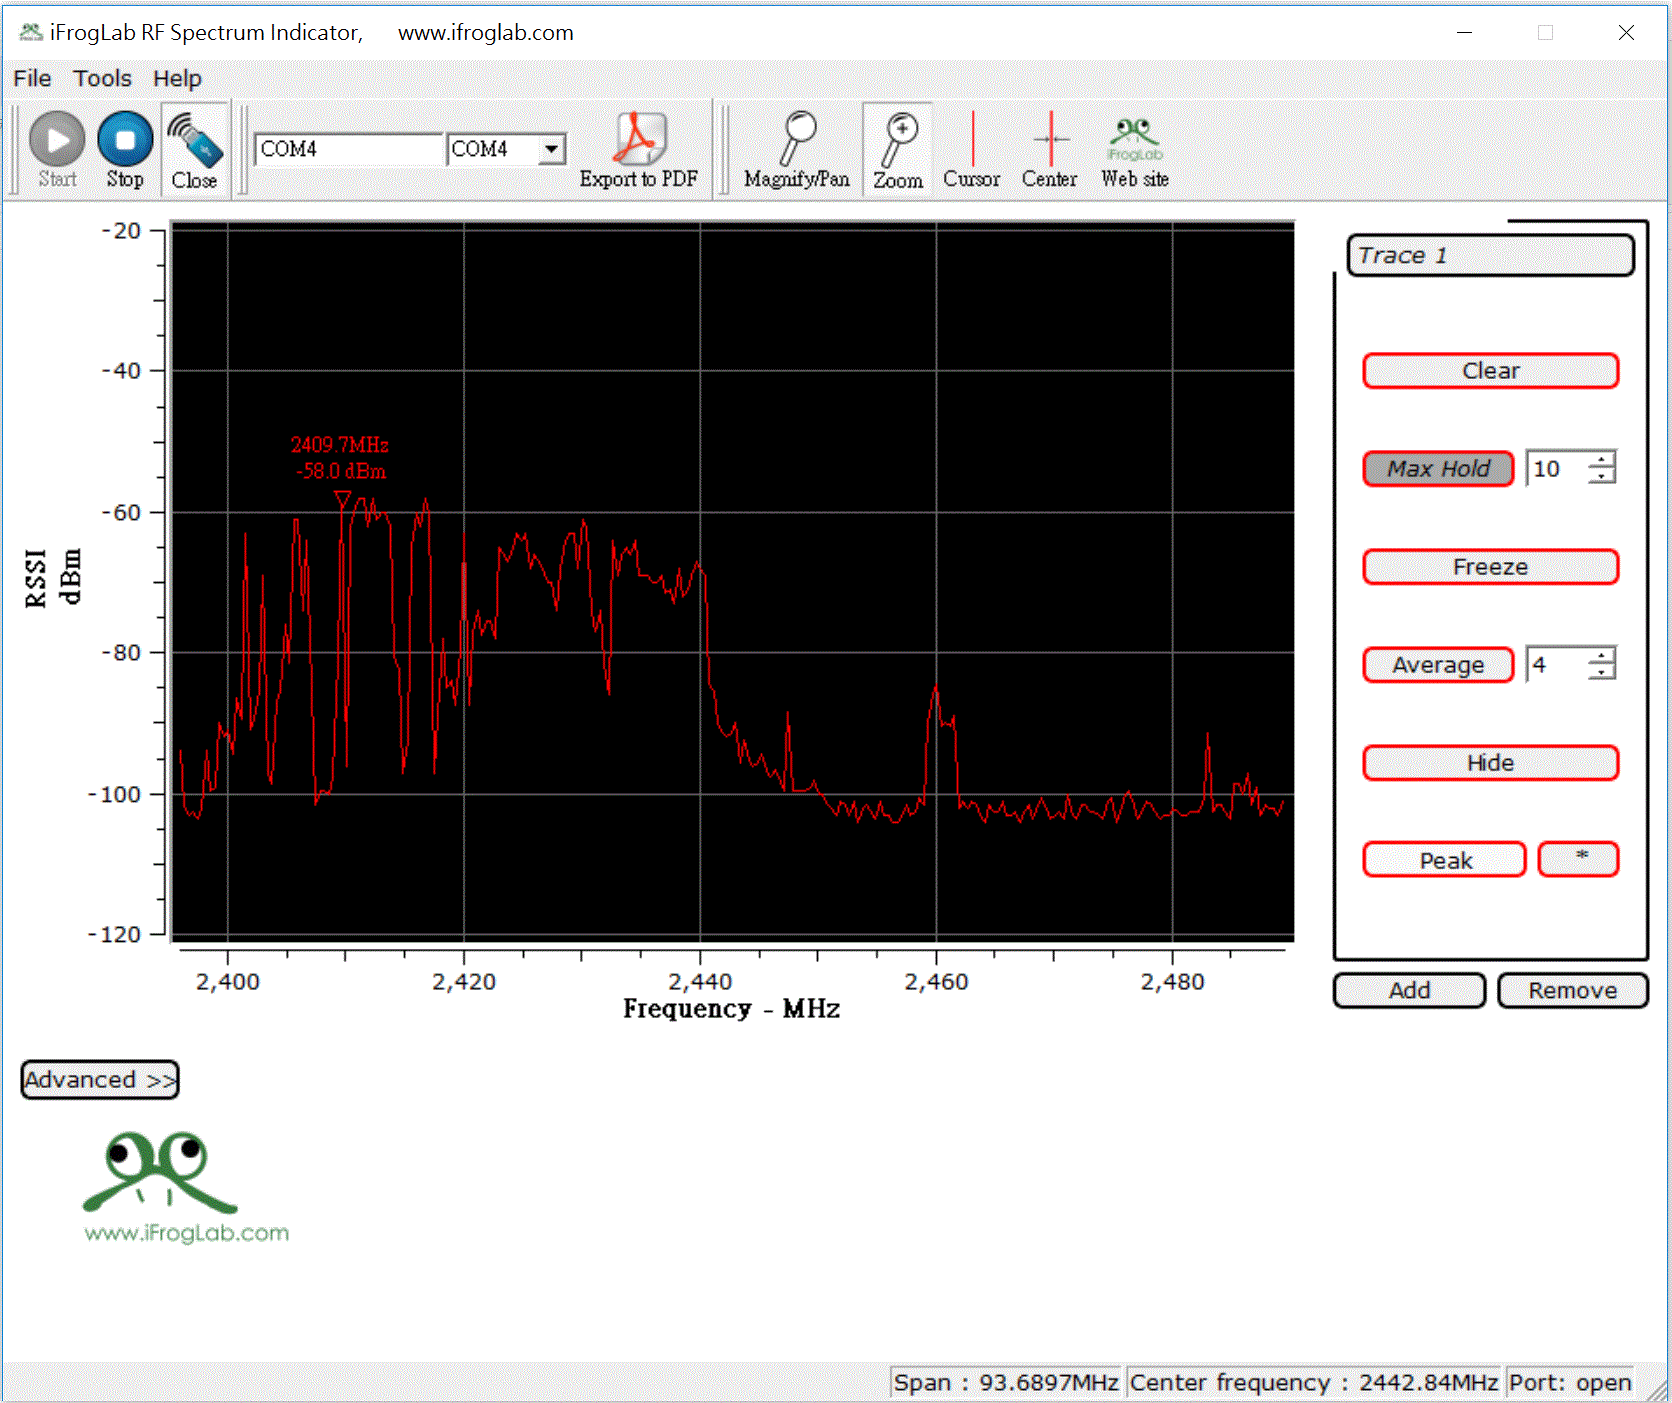
This application is meant to simulate the functionality of a spectrum analyzer. Usually such analyzers are expensive stand alone equipment used in laboratories. This application simulates the functionality by reading signal strength indicator values from a Texas Instruments chip. The value is the so called RSSI (Received Signal Strength Indicator).
User interaction
The user is mainly interacting with the application through adding/ removing traces, controlling their state, zooming, panning, magnifying and adding/ removing cursors. The functionality is based on a real spectrum analyzer, though the interaction benefits from the extensive computational power of a computer. This means that instead of pushing buttons, the user will interact with the mouse.
Trace
A trace has two main properties. It has one Curve and one Peak Marker attached to the plot.
– State
The user can change the state by clicking on the buttons in the toolbox on the right side of the screen.
– Normal: The curve is continuosly updated.
– Max Hold: The curve is always displaying the maximum value of the latest samples. The number of samples to find the maximum value from is set in the spinbox on the right side of the Max Hold button.
– Freeze: The curve is no longer updated.
– Average: The curve is displaying the average of the latest samples. The number of samples to average over is set in the spinbox on the right side of the Average button.
Plot navigation
In the toolbar on the top right are the plot navigation tool selection. There are three main tools, though there are more buttons, Magnify/Pan, Zoom and Cursor. Activate either tool by clicking the respective button.
– Magnify/Pan
Move the plot by pressing left mouse button while moving. Magnify by rolling the wheel of your mouse.
– Zoom
Zoom by pressing left mouse button while moving, the appearing square indicates the area that will be zoomed in on. Go back to original view by pressing right mouse button.
– Cursor
A cursor will be set where the left mouse button is clicked. The cursor will be removed by clicking the cursor again. This might require some getting used to. The resolution of how close cursors can be set is equal to how close to a cursor one has to click to remove it. This resolution is currently equal to the number of points measured in one plot. Draw a Curve with dots to get an impression of the resolution.
Cursor has a neat extra feature. Clicking the Center button will center the plot according to the latest cursor set.
Advanced
Pushing the Advanced button will give the user direct control over the essential parameters. The essential parameters are Start Frequency and Resolution Band Width. It also displays the according channel spacing, which is also an essential parameter.
See documentation to learn more about the underlying functionality.
Export
The application support exporting the plot to pdf. Currently there is no control over what is exported, other than the properties already set when choosing to export. The curves, cursors, markers, grid, scales and axis labels are exported as displayed in the application, except from the black background. Hence white curves will not show in the exported plot.


No Comments